1.5.2 Profile of Tama City
Tokyo is one of the 47 prefectures and capital of Japan. Tama City is located in the western suburbs of Metropolitan Tokyo, covering an area of 19.92 km2in 2012. Construction of Tama New Town started in 1966 in order to create integrated living-working commuting communities as Japan's largest residential development. The first round of occupants began moving in 1971, when Tama was classified as a city.
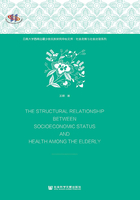
As of 1971, there were 25105 citizens living in Tama City, and only 5.2% of them were aged≥65 years(Figure1-9). Along with young citizens moving, two years later, the proportion of the elderly was 3.7%. The number of inhabitants steadily grew until 1995, with the population of 145677 at peak, dropping to 141039 in 2003. The population of Tama City has remained at around 140000 over the past two decades. However, the young population has decreased since 1988, and the reproductive age population has reduced since 1996. Forty years later, as young adults gradually increased in age, the proportion of the elderly increased remarkably. In 1995, the proportion of elderly aged≥65 years was 6.8%, reaching 14.2% in 2005. It took just 20 years to double the proportion of the elderly. Tama City has entered hyper-aged society since 2012, since 21% of total population were elderly people.
In additional to low fertility, the life expectancy at birth of Tama City was high for both men and women compared with overall Tokyo, and women generally lived longer than men(Figure 1-10). The life expectancy at birth was 77.9 years for men and 84.1 years for women in Tama City in 1995; in Tokyo the corresponding figures were 76.7 for men and 83.1 for women. In 2010, the life expectancy at birth in men was 79.9 in Tokyo, and 81.5 in Tama City; in women these were 86.4 and 87.2, respectively. The trends were clearly observed for males and females, as well as for Tokyo and Tama City. In addition, Tama City has the lowest longterm care needs for both men and women in Tokyo.

Figure 1-9 The population trend of Tama City from 1971 to 2013
Source: Tama City Hall.(2013). “Tama City census”(in Japanese). Retrieved from http://www.city.tama.lg.jp/zaisei/kokuzei/017520.html.

Figure 1-10 Life expectancy at birth in Tokyo and Tama City by gender
Sources: Tama City Hall.(2013). “Tama City census”(in Japanese). Retrieved from http://www.city.tama.lg.jp/zaisei/kokuzei/017520.html.
Ministry of Health, Labor and Welfare.(2012). “Life Table 2011”. Tokyo:Health and Welfare Statistics Association.