1.1.2 Population Aging in Japan
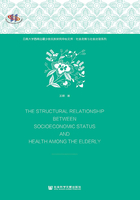
From the 18th century to the first half of the 19th century, the Japanese population remained steady at approximately 30 million. After the Meiji Restoration in 1868, it started expanding in order to build a modern nation-state. The number reached 60 million in 1926, and surpassed 100 million in 1967. During this period, the population increased at a rapid rate. In 1960, the rate of increase suddenly dropped to below 1%. After that, the annual pace of population growth was around 1% from the 1960s to the 1970s. Since the 1980s, it has declined consistently. More recently, the population in Japan has showed negative growth from 2011. Table 1-2, the Japanese total population in 2012 was 127.52 million. This ranked Japan as tenth across the world at 1.8% of the global population. Among the Japanese population, about 30.73 million were aged≥65 years(14.95 million men and 15.78 million women). People aged≥65 years accounted for 24.1% of the total population, the highest in the world; that is, a quarter of Japanese are aged 65 and over. Figure 1-3 illustrates the aging trend of population age≥65 years in Japan from 1900 to 2050. From the 1960s, the proportion of elderly people has been raising consistently and alarmingly. The proportion lines of elderly men and women started to separate since 1940, with more women than men due to women's longer average life expectancy which has had accumulative effects. The differences in the number of men and women have been clearly observed.

Figure 1-2 Proportion of elderly population by country from 1950 to 2050(age≥65 years)
Source: United Nations, Department of Economic and Social Affairs, Population Division.(2011). “World population prospects: the 2010 version”. Retrieved from http://esa.un.org/wpp/Excel-Data/population.htm.
Table 1-2 Trends in Population of Japan from 1900 to 2050

∗The numbers and percentages after 2012 were projected in 2012.
Source: National Institute of Population and Social Security Research.(2012). “Population Statistics”. Retrieved from http://www.ipss.go.jp/p-info/e/S_D_I/Indip.asp.
The biggest challenge caused by the rapid population aging in Japan is the soaring expenditure in social security benefits(Figure 1-4). It is clear that the social security benefits including pensions, medical services and welfare sharply increased during the past four decades from 3.5 trillion Japanese yen in 1970 to 109.5 trillion in 2012. In the 2012 fiscal year, pensions accounted for half of the total security benefit expenditure(53.8/109.5=49.1), while medical care accounted for 32.1 percent(35.1/109.5), and social welfare and others for 18.8 percent(20.6/109.5). The proportion of total benefits to national income has been growing rapidly and consistently: 5.8% in 1970, 12.2% in 1980, 13.6% in 1990, 21.0% in 2000 and 31.3% in 2012, respectively. In addition, social security benefit expenditure is forecasted to continue to rise, and has been projected to reach 149 trillion Japanese yen in the 2025 fiscal year.

Figure 1-3 Population age 65 years and over in Japan from 1900 to 2050
Note: The numbers and percentages after 2012 were projected in 2012.
Sources: National Institute of Population and Social Security Research.(2012).“Population Statistics”. Retrieved from http://www.ipss.go.jp/p-info/e/S_D_I/Indip.asp.

Figure 1-4 Trends in social security benefits of Japan from 1970 to 2012
Note: Social security benefit expenditures=Pension+Medical services+Welfare.
Sources: Ministry of Health, Labor and Welfare.(2012). “Annual Health, Labor and Welfare Report 2011-2012. General Welfare and Labor”. Retrieved from http://www.mhlw.go.jp/english/wp/wp-hw6/dl/01e.pdf.